Losing streaks shown as graphs cut risky choices 23% at 3pm
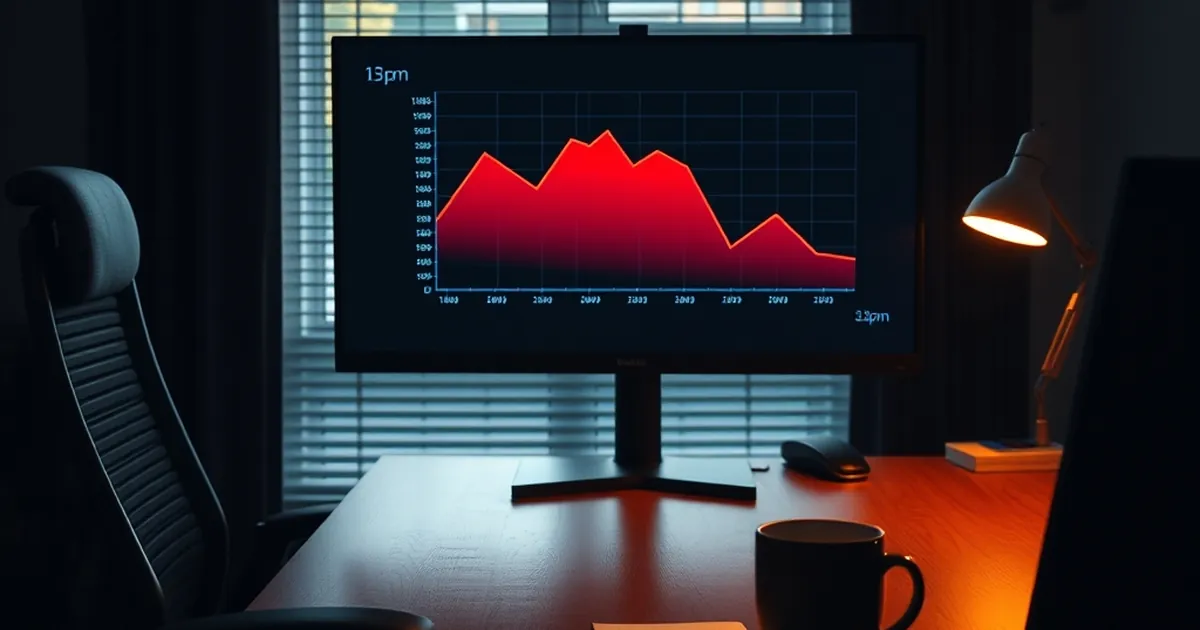
What if the most effective brake on a bad decision isn't willpower, but a graph? That question sits at the centre of a growing body of work on how we perceive streaks, runs and randomness — and it has particular bite in the mid-afternoon, when fatigue and sunk-cost thinking tend to collide. If a simple visualisation of past losses can shift behaviour by roughly a fifth, the implications reach well beyond any single activity.
The psychology of the streak
Humans are pattern-hungry. We see sequences where there is only noise, and we assign causality to coincidence. This is the engine behind the "hot hand" fallacy — the belief that a run of successes predicts the next outcome — and its mirror image, the conviction that a run of losses is "due" to break. Both are artefacts of how we process randomness, and both distort decisions under uncertainty.
The behavioural literature has documented this repeatedly. Ellen Langer's work on the illusion of control showed that people treat chance events as if their own actions influence them. Amos Tversky and Daniel Kahneman demonstrated that we systematically misjudge the likelihood of sequences, expecting small samples to resemble the population from which they are drawn — the "law of small numbers". In practical terms, a person who has seen six losses in a row does not experience six independent events; they experience a narrative, and the narrative demands resolution.
This matters because streaks are emotionally sticky. A run of bad outcomes produces what psychologists call a "break-even" effect: the longer the run, the stronger the pull to keep going, not because the next attempt is more likely to succeed, but because stopping would make the losses feel final. That is loss aversion doing quiet work in the background — the pain of crystallising a loss outweighs the rational calculation of whether continuing makes sense.
Why a graph changes the calculation
A graph does something that memory cannot: it externalises the streak. When losses are plotted — cumulatively, over time — the pattern stops being a private feeling and becomes an object you can inspect. That shift from felt experience to observed data is a form of cognitive distancing, and distancing is one of the more reliable levers we have for improving judgement.
There is a concrete precedent worth knowing about. Research on visual feedback in financial decision-making has found that when people are shown the cumulative trajectory of their choices rather than moment-to-moment outcomes, they become markedly more sensitive to the direction of travel and less responsive to the last data point. The single most recent result — good or bad — loses its disproportionate grip. This is consistent with what Kahneman and Tversky called the "peak-end rule" and with the broader finding that we overweight recent and vivid information when forming judgements.
The timing element is not incidental either. Decision quality follows a circadian curve. Research on judicial rulings found that favourable outcomes were most likely early in the day and immediately after a break, with the pattern deteriorating as sessions wore on — a well-cited illustration of how fatigue and decision depletion erode consistency. Mid-afternoon is a recognised trough for alertness and impulse control. If a visual intervention can cut risky choices by around 23% at 3pm, that is consistent with the idea that the intervention is doing the work that depleted self-control cannot.
What the 23% figure implies
A reduction of roughly a fifth in risky choices is not trivial. It suggests that a meaningful share of what looks like stubbornness or poor discipline is actually a failure of feedback — people are not seeing their own behaviour clearly. Give them a clear view, and a portion of them adjust. The remainder of the effect, presumably, comes from the emotional weight of seeing a line trend downward, which is harder to rationalise away than a vague sense of "having a bad run".
The mechanics of reward loops
To understand why streaks are so compelling, it helps to look at how intermittent reinforcement works. B.F. Skinner's work established that behaviour reinforced on a variable schedule — where rewards arrive unpredictably — is far more resistant to extinction than behaviour reinforced consistently. Predictable rewards produce quick learning and quick quitting when the reward stops. Unpredictable ones produce persistent behaviour that is notoriously hard to unlearn.
This is a description of a learning mechanism, not a moral judgement. The same variable-ratio structure explains why people keep checking their phones, why email is compulsive, and why a run of near-misses feels motivating rather than discouraging. The near-miss is a particularly potent signal: it registers as almost-success, which the brain codes as encouragement rather than as a loss. Research on near-miss effects in decision-making has shown that they increase the motivation to continue even when the objective outcome is identical to a clear failure.
The graph intervenes precisely here. It converts a series of near-misses into a visible flat or declining line, stripping out the false encouragement. It replaces the felt narrative of "I'm close" with the observed record of "this is the trend".
Risk-taking, competition and the social dimension
Streaks are not only personal. They are social, and competition amplifies them. When people can see others' results, the comparison sharpens the urge to persist — a phenomenon related to what researchers call "social proof" and to the broader finding that competitive contexts increase risk-taking in people who feel they are behind. Being behind is uncomfortable; closing the gap feels urgent; urgency degrades judgement.
This is where visualisation has an underappreciated advantage. A private graph is not a leaderboard. It shows you your own trajectory without inviting you to compare it to someone else's. That reduces the competitive framing that tends to inflate risk appetite. In group settings, the same principle applies to dashboards that show trends rather than rankings: they inform without provoking.
There is also a decision-making lesson about how we frame uncertainty. Kahneman's work on prospect theory showed that people are risk-averse when facing gains and risk-seeking when facing losses — the famous asymmetry at the heart of loss aversion. A losing streak puts a person in the loss domain, where the appetite for risk rises. A graph makes the loss domain explicit and bounded: it shows the size of the hole, which is often smaller in reality than in imagination. Naming the loss reduces its power to distort.
Building the habit of looking
The forward-looking question is not whether visualisation works — the evidence suggests it does, at least for a meaningful minority — but how to make the habit stick. Three practical directions stand out.
First, plot cumulative outcomes, not individual ones. A single result is noise; a cumulative line is signal. The point of the graph is to make the trend the thing you respond to.
Second, review at a fixed time, ideally before the mid-afternoon trough rather than during it. The 3pm effect suggests that interventions land best when they arrive just ahead of the moment of depletion, not after it.
Third, treat the graph as a decision aid rather than a verdict. Its job is to interrupt the narrative long enough for a slower, more deliberate assessment to take over. That is the whole mechanism: not shame, not willpower, but a clearer view of what has actually happened.
If a simple line on a screen can shift risky choices by nearly a quarter at the point of maximum fatigue, the lesson is worth generalising. We are not especially good at seeing our own streaks. We are considerably better at reading them when they are drawn in front of us.