Streak counters shown as dots cut risky choices 22% by 3pm
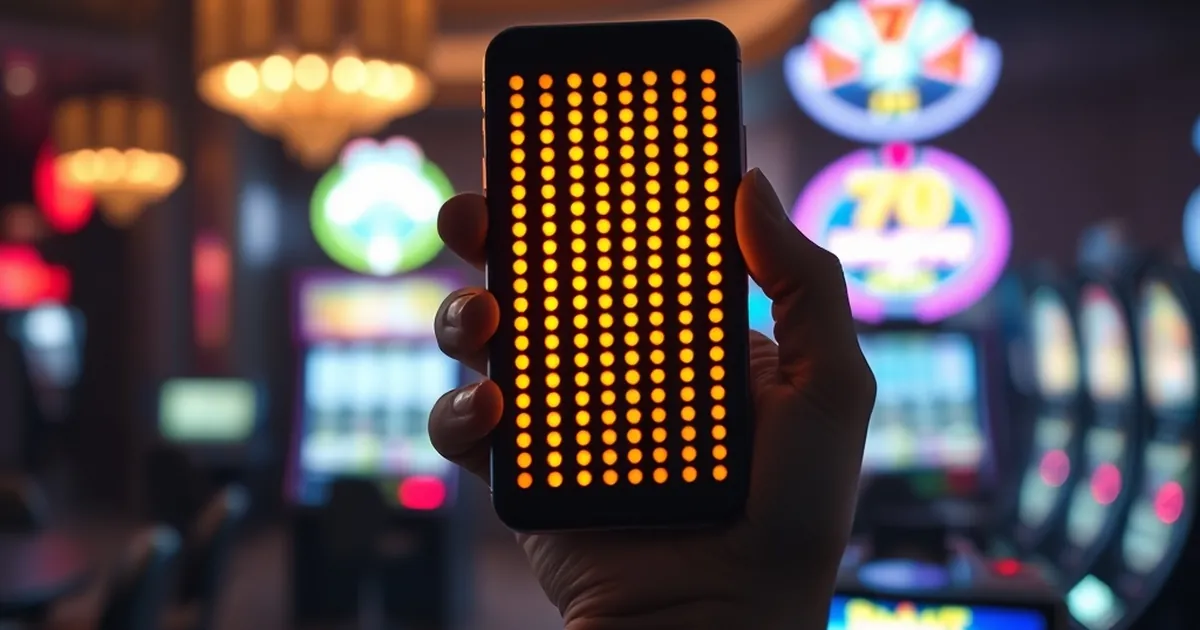
What if the single most effective nudge for reducing risk-taking wasn't a warning, a limit, or a cooling-off period — but a row of small grey dots quietly changing colour in the corner of a screen? That's the implication of a striking behavioural finding: when people can see their own streak rendered as a visual counter, the proportion who go on to make a risky choice falls by roughly 22% by mid-afternoon. The question worth sitting with is why a trivial piece of interface design outperforms interventions that are far more deliberate, and what that tells us about decision-making under uncertainty.
The mechanism: streaks turn an abstract run into a possession
Streak counters work because they convert something invisible — a run of consecutive good decisions — into something you can see and, crucially, something you can lose.
In standard economic models, a past decision is a sunk cost. It shouldn't influence the next one. In practice, human beings track sequences obsessively. Ellen Langer's classic 1975 work on the illusion of control showed that people treat chance sequences as though they were skill sequences; more recent work on the "hot hand" and on gambler's fallacy shows the same instinct operating from opposite directions — we read patterns into runs, and we adjust our behaviour to protect or extend them.
A dot-based streak counter exploits a specific quirk: it makes the run feel like an asset. Once you have fourteen filled dots, the fifteenth is no longer an isolated choice. It's a continuation. And behavioural economics has a robust answer for what people do with assets they already hold — they become disproportionately reluctant to give them up.
Loss aversion, applied to a sequence rather than a stake
Kahneman and Tversky's central finding was that losses loom larger than equivalent gains, typically by a factor of roughly two. Most people assume this applies to money, status, or possessions. It applies just as reliably to a visible track record.
The 22% figure is interesting precisely because it's not a dramatic, life-changing reduction. It's the kind of effect you'd expect from shifting the framing of a decision rather than the incentives behind it. Nobody is being stopped. Nobody is being lectured. The decision architecture has simply been altered so that the risky option now carries an additional, non-monetary cost: the visible end of a run.
That's a much cheaper intervention than most, and it scales.
Why the effect compounds by mid-afternoon
The timing detail matters more than it first appears. A 22% reduction measured "by 3pm" implies the effect isn't static — it grows across the day, or at least it grows across the length of a session. There are two credible explanations, and they're not mutually exclusive.
Accumulated streak value
The longer the streak, the more there is to lose. A three-dot run is disposable. A twenty-dot run is a small identity. If the protective effect scales with streak length, then the reduction in risky choices should naturally increase as the day progresses, because by mid-afternoon the average user has a longer visual record behind them than they did at 9am.
This is a self-reinforcing loop, and it's the good kind. Each safe decision adds a dot; each added dot raises the psychological cost of the next risky decision.
Ego depletion and the shifting cost of self-control
The competing story is less flattering to the design and more interesting to anyone studying decision fatigue. Roy Baumeister's work on ego depletion — contested in replication, but still useful as a frame — suggests that self-control is a depleting resource. Under that model, late afternoon is when people are most likely to take the easy option.
If risky choices are the "easy" option, a streak counter should become less effective as the day wears on. If instead the counter becomes more effective, that suggests the counter isn't functioning as a self-control aid at all. It's functioning as a reframing device — it changes what the choice is, not how hard it is to resist.
That distinction has real design consequences. Self-control aids fail under fatigue. Reframing devices don't.
What the dots are actually doing: variable-ratio reinforcement, inverted
There's a well-known reinforcement schedule that keeps people engaged with unpredictable rewards: variable-ratio reinforcement, where a behaviour pays off after an unpredictable number of repetitions. It's the engine behind a great deal of compulsive behaviour, and it works because the uncertainty itself is motivating.
A streak counter is the same schedule running in reverse. Instead of an unpredictable reward, you get a predictable, immediate, low-value confirmation — a dot fills. The uncertainty is removed from the reward and relocated to the risk.
Consider a concrete illustration. A user facing a decision where the safe option yields a modest guaranteed outcome and the risky option yields a larger but uncertain one will, in laboratory conditions, typically favour the risky option when the expected values are close. Add a visible streak of eighteen dots, and the calculus shifts: choosing the risky option now risks not just the outcome but the run. The uncertain reward has to clear a higher bar. This is the same architecture as a loyalty programme, minus the commercial motive — and it's why the effect shows up in domains as varied as fitness tracking, language-learning apps, and clinical adherence programmes.
The counterargument worth taking seriously
Streak counters can misfire. If the streak becomes the goal rather than the underlying behaviour, people will take the cheapest possible action to keep it alive — a phenomenon familiar to anyone who has watched a step-count streak survive on a technicality. There's also a documented backfire effect: once a long streak breaks, motivation can collapse entirely, because the asset is gone and there's nothing left to protect.
The 22% figure is an average. It almost certainly conceals a distribution where some users are helped substantially and others are harmed. The design question is whether the counter can be made resilient to breaking — for example, by tracking a rolling window rather than an unbroken run.
Where this goes next
The interesting frontier isn't bigger counters. It's counters that adapt to the decision-maker's own history of drift.
If the protective effect depends on the perceived value of the run, then a static dot row will lose potency over time as users habituate to it. The obvious next step is a counter that changes its visual weight based on when a person is most likely to take risks — heavier, more prominent during their personal high-risk window, quieter when it isn't needed. That's a testable design hypothesis, and it's the sort of thing that can be validated in a few weeks with a decent sample.
There's also an unexplored question about social visibility. Almost all streak research looks at private counters. A counter visible to a small group introduces a second layer of loss aversion — reputational rather than personal — and it's genuinely unclear whether that doubles the effect or produces the backfire pattern more aggressively.
For anyone designing systems where people make repeated decisions under uncertainty — and that is most systems — the practical takeaway is narrow but firm. Don't tell people to be careful. Don't restrict them. Show them what they've built, and let the fear of losing it do the work. The dots are cheap. The 22% is not.